Final Presentation

Attached is my Final Presentation for EDTC 615

https://screencast-o-matic.com/watch/cqjecvOHwz

This last presentation was a chance to reflect over the entire class and the entire Data Action Model process. The whole process was very eye opening for me. I had some experience with the Data Action Model at the school level. My school has used this to go over standardized testing scores and to come up with ideas on how to improve them. I can honestly say I never found the value in it for a Physical Education teacher. By going through the process in this class, my perspective has changed. I was able to see it in a new light. Even though my group decided to analyze Kindergarten math scores and objectives, I was able to see how it works at the classroom level. I was also able to see how Physical Education and other creative arts classes can be incorporated into the implementation plans.

It was also rewarding to work with two other experienced educators. It was great to collaborate with Sam and Jordan throughout all of our data meetings. They were extremely knowledgeable about their content area and were always willing to listen to my ideas when I was trying to incorporate PE.

I now feel prepared to be able to contribute to the process at my school when we get back to school this year!

Data Meeting #5

Below is the link for my Data Meeting #5 Presentation

https://drive.google.com/file/d/10jJ89ULacwtb-ODWhryleG2pzweIAzH5/view?usp=sharing

Data meeting #5 consisted of meeting with a new partner to discuss and analyze the SMART goals, ask any questions we might have, and provide feedback to each other.

I found this meeting very valuable to be able look at another team’s data and be able to share ideas and suggestions to make the students’ learning optimal. I felt that both team 2 and team 3 had valuable, realistic implementation plans to make sure that the students were going to be meeting their goals. Both teams also included authentic technology tools that will help them in reaching their goals.

Data Meeting #4

Below is the link to our Data Meeting #4 multimedia presentation:

https://drive.google.com/file/d/1Oc2DuHJBEQ1QO7ehVQFLCvw51Pgi_Aox/view

Here is the link for our artifact tracking sheet:

https://docs.google.com/document/d/1T_KTsWCGH41-xGmSs400WbYdwuArFHSCJ19nW63iWaU/edit?usp=sharing

Data Meeting #4 went very well with my groupmates. All 3 of us came prepared for the meeting and we all worked together to fill in the tracking sheet and create the presentation. We were tasked with coming up with an action plan. We had to start with redoing our SMART goals per our feedback from Data Meeting #3. So we tweaked all of them before beginning our work.

SMART Goal 1: During the 2019-2020 school year, students will become a math fact master by passing an addition fluency test by answering 10 addition problems by at least 80% accuracy within 1 minute.

SMART Goal 2: During the 2019-2020 school year, students will become a math fact master by passing a subtraction fluency test by answering 10 subtraction problems by at least 80% accuracy within 1 minute.

SMART Goal 3: During the 2019-2020 school year, students will become a math fact master by passing a mixed addition and subtraction fluency test by answering 5 addition and 5 subtraction problems by at least 80% accuracy within 1 minute.

We then came up with a bunch of technology-based tactic methods that the students could use weekly to ensure they had ample practice time, which would ultimately increase their scores. We also used a variety of different learning methods such as audio, visual and kinesthetic to allow students of all different learning abilities to be successful. We also had different classroom setups such as whole group, small group and individual to make sure students could have different environments throughout the learning process.

Data Meeting #3

Below is the link to our Data Meeting #3 Presentation

https://drive.google.com/file/d/1fFVGZ7-K09hE9aaeLuRWFleZF2Ko8TG4/view?usp=sharing

Data Meeting #3 went extremely well for our team. We communicated via Google Docs, email and text to figure out what we needed for the meeting and when we would meet. We then used Zoom to conduct our meeting. This allowed us to all share screens and discuss the information that we needed for Jordan to create the multimedia presentation.

Our exploratory question is “How are we presently teaching addition and subtraction and why are our students performing so poorly?” We decided as a team that our instructional/learning gaps were due to needing more time in general for teaching. We also decided that cross-curricular planning with the Creative Arts/Health & PE classes could be integral in the students learning and reiterating the information that they are learning in the content area classes.

We came up with 3 SMART goals to go along with our instructional/learning gaps. We then came up with 3 assessments to go along with each goal.

During the 2019-2020 school year, 70% of all students will become a math fact master by passing an addition fluency test by answering 10 addition problems correctly within 1 minute.
During the 2019-2020 school year, 70% of all students will become a math fact master by passing a subtraction fluency test by answering 10 subtraction problems correctly within 1 minute.
During the 2019-2020 school year, 70% of all students will become a math fact master by passing a mixed addition and subtraction fluency test by answering 5 addition and 5 subtraction problems correctly within 1 minute.


Data Meeting #2

Below is the attached video to Team 2 data meeting:

https://drive.google.com/file/d/1Ka8AnHgAhW1_zA3K7oQ3JNKMo8rodHOh/view?usp=sharing

This second data meeting went extremely well. Jordan, Samantha and myself worked together through a variety of methods throughout the week such as Google Docs, texting, and email. We each prepared a ton of artifacts to present to the team when we met Wednesday on Zoom. Using Zoom enabled us to share our screens to present our artifacts, discuss what we needed and talk about our ideas for future planning.

We found that by analyzing our artifacts and data, that we all think we don’t have enough time to cover materials. There are so many tests and tasks that we have to fit into the school year that prohibits us from focusing on the curriculum. We all have to deal with standardized testing, SLO’s (student learning objectives), Literacy tasks and much more which take up teaching time. This leads us to our exploratory question. How are we presently teaching addition and subtraction and why are our students performing so poorly?

As a PE teacher, I was able to see one of the artifacts that Samantha posted, could easily be transferred to a PE lesson. It was a lesson on subtraction by using bowling. Bowling and underhand throwing is a PE lesson in the Kindergarten curriculum.

By putting together our data, artifacts, and thinking about our lack of time, we came up with an idea about cross curricular planning and lesson collaborations. We will be exploring this for our action plan for Data meeting #3.


Data Meeting #1

While I joined Group 2 a little later after they had already analyzed the data, I added my own noticings, wonderings, and exploratory questions to the Google Doc so that I was contributing to this week. By the time I switched teams, I found that most teams would probably have completed their first data analysis. I decided to stick with Team 2 and just add to their well-done work with my own noticings and wonderings and exploratory questions. I found the data very interesting as I don’t deal with elementary-aged lessons. After working at my middle school and hearing some of the background stories of the students, I always wonder what could possibly be happening at the home when I look at scores. I wonder why some of the students are doing so poorly? I wonder if the students have a good support system at home, if they are mainly watched by an older sibling or if they have no supervision at all.  My team wants to keep diving into this current Kindergarten Math data, so I’ll be interested to see how we can analyze it further!

Since I am a PE teacher, I wonder if the shortcomings of the students that the data presents shouldn’t just fall on the math teacher. We have looked at data in my middle school the past maybe two years and honestly have felt it a little mundane and not relating to me. But maybe I’m wrong in that thinking? Can there be more cross-curricular planning periods so that lessons like these ones are reinforced across the board?

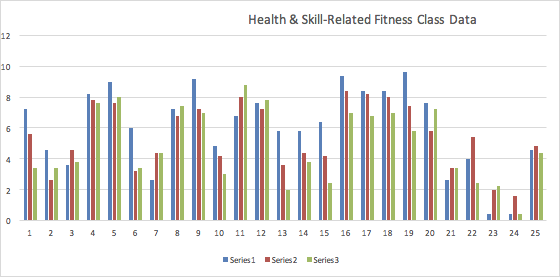
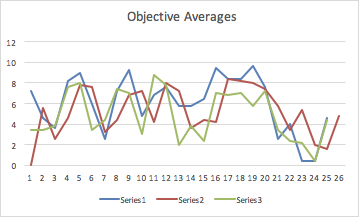
As far as my data goes, I was analyzing the data of the difference between Health-related fitness components and Skill-related fitness. I found that it seems the students did better on the Health-related fitness which I would think the opposite. Most students do not think of the health components of PE and only think about the physical aspect! It was interesting for me to try and figure out WHY the some of the students aren’t doing that well? How is their home life? Do they have good attendance? Do they even care?